
The Country Transition Tracker for 2026 is currently in development and will be released later this year. In the meantime, we encourage you to explore last year's Tracker to understand how national energy systems are evolving, or to draw on the latest insights from this year's Statistical Review of World Energy.
Released in June 2025, the EI Statistical Review of World Energy (Statistical Review) reported another year of highs in our energy hungry world. Record consumption of fossil fuels and record emissions from energy, but also record generation of renewables, driven by increasingly competitive wind and solar energy.
The EI Country Transition Tracker assesses the data of around 80 of the world's largest energy-consuming countries that are itemised in the Statistical Review, representing more than 96% of global energy consumption and 95% of global emissions. This report enables users to assess progress towards targets set under the Paris Agreement.
In 2023, at COP28, the first global stocktake was finalised which assessed action taken under the Paris Agreement. This was the first indicator of progress made by Parties towards their nationally determined contributions (NDCs). While it recognised progress had been made, it also signalled that efforts have been insufficient to reach long-term targets. The results of the stocktake provided direction for the next set of NDCs.
Conducting the global stocktake is a two-year process scheduled to happen every five years and the next set of results are not scheduled for release until 2028 and again in 2033 etc.; a level of frequency that allows for just 5 more global stocktakes between now and 2050, the critical date for limiting the rise in global temperatures to around 1.5°C.
Updated annually, the EI Country Transition Tracker has been specifically designed to provide users with a more frequent update of energy transition progress. Recognising that the energy transition is not limited to addressing climate change, the Country Transition Tracker uses country-level data contained in the Statistical Review to build a picture of energy-specific transition progress across three broad fronts:
Ultimately it provides users with a regular means to draw their own conclusions about whether or not the world is on track to meet its 2050 targets. As such, it measures progress made since 2017, the first full year after formal ratification of the Paris Agreement, the driver for near-universal climate action.
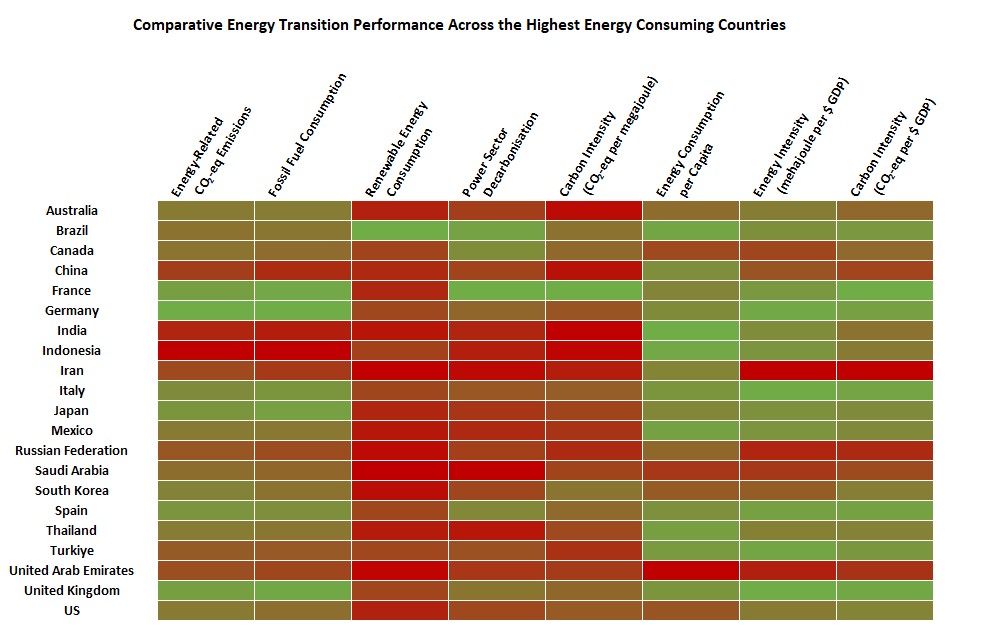
Summarising data from across 2017 to 2024 for the leading 21 (collectively responsible for 80% of total global energy consumption) of the 80 countries featured in the Statistical Review, it is apparent that progress across the eight metrics assessed by the Country Transition Tracker is highly varied. The relative positioning of a country’s progress is reflected by how green its ratings are. The highest area of lag is in the contribution of renewable energy to the total energy mix which is primarily limited to decarbonisation of their power sectors. The most advanced countries on these metrics are Brazil and the Western European countries France, Germany, Spain and the UK.
The Energy Transition Landscape chart plots the relative positioning of the world’s highest energy consuming countries according through three lenses:
Over time, positive energy transition progress will see nations move down the Y-axis, along the X-axis, and into the bottom right-hand quadrant.
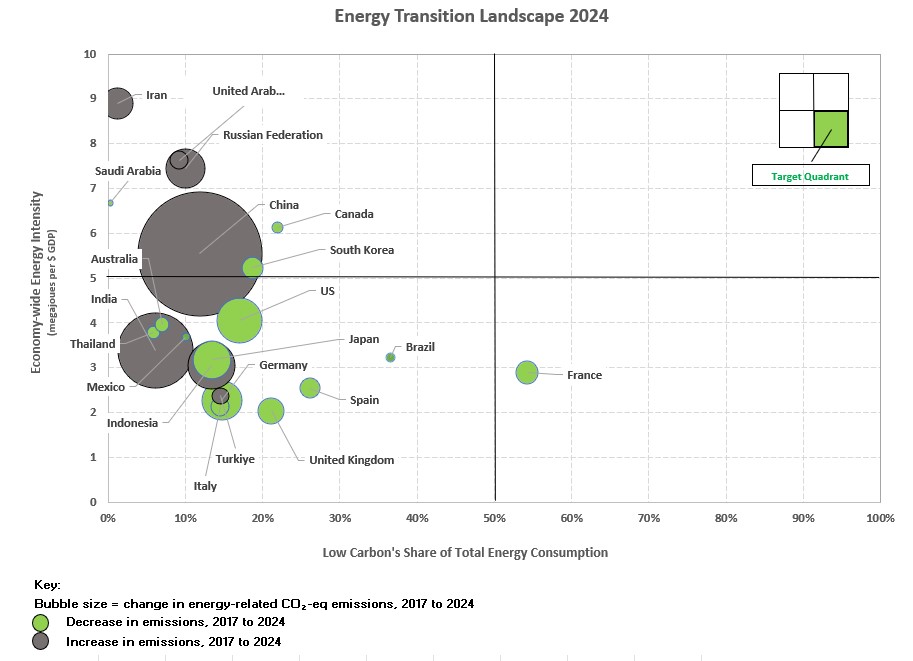
Within the 21 highest energy consuming nations, France has the highest share of energy from low carbon sources, primarily due to nuclear energy, which sees it succeed as the first nation to enter the target quadrant. Outside of the 21 highest energy consuming nations, although Iceland is the most advanced country in terms of renewable energy consumption with 83% of total energy consumed coming from sustainable sources, its extremely high energy intensity would see it positioned in the top right-hand quadrant.
Between 2017 and 2024, greenhouse gas emissions from energy increased on average by 0.7% each year. During this period, global energy markets were disrupted by both the COVID-19 pandemic and conflict in Ukraine (significantly impacting its own energy demand). The largest reductions in emissions were achieved by USA and Japan (265 and 197 million tonnes respectively). The large percentage rises in energy related emissions witnessed by China and India between 2017 and 2024 were also reflected in large rises in absolute volumes, 2,099 and 760 million tonnes respectively. Over 60% of the 70 countries listed in the Statistical Review saw emission reductions between 2017 and 2024. However, China’s rise alone was sufficient to offset the total number of reductions made elsewhere in the world across this period.
Between 2017 and 2024, global consumption of fossil fuels grew by 7% (34 EJ). The largest increase was in demand for natural gas which increased by 13% (17 exajoules), followed by coal which increased by 6% (9 EJs), and oil which increased by 4% (7 exajoules). A net increase in global demand for coal was primarily led by China and India (13 and 6 EJ respectively). The US reduced its coal consumption by 40%, a decline of 6 exajoules and the largest fall of any nation.
Renewable consumption (including hydroelectricity) grew in 75 out of the 79 countries, in absolute terms, between 2017 and 2024. However, despite renewable consumption more than doubling over this period, renewable energy still only met around 8% of global energy demand in 2024. China was by far the biggest market for renewable energy, growing by over 7 exajoules, followed by the US and India. European nations accounted for eight of the ten highest ranked countries. Countries in the Middle East accounted for five of the ten lowest positions.
The power sector is often cited as one of the easier sectors to decarbonise with a range of proven low- and zero-carbon technologies (renewable and nuclear) to invest in as well as high efficiency gas-fired combined cycle gas turbines (CCGTs), a readily deployable and relatively low carbon intensive fossil fuel option to displace more carbon intensive and less efficient coal, oil, and diesel plant. Whilst China ranks the highest in terms of actual generation from low carbon sources, combined they contribute to around 38% of its total generation placing it 15th in this ranking. Generation from solar sources in China saw the largest share increase up from 6% in 2023 to 8% in 2024. China is followed by the US and then Brazil in terms of actual volume of output from low carbon sources. France has the most decarbonised power sector with 95% of generation from low- and zero-carbon sources, with nuclear contributing to 68% of the total generation, followed by Brazil at 89%.
The carbon intensity ratio of greenhouse gas emissions to energy consumption is an indicator of how clean an energy system is with respect to emitting harmful gases that contribute to climate change. It is one of a range of metrics that can be used to measure how efficiently economic and social activities are at consuming energy. It is heavily influenced by both the mix of energy inputs and the efficiency of conversion and end-use technologies deployed within a given system. For instance, for power generation, a modern coal-fired plant emits around 950 grammes of CO2/kWh whereas a more efficient combined cycle gas turbine emits around 350 grammes of CO2/kWh. Countries such as Sweden, France, and Norway that rely heavily on renewables and/or nuclear power have particularly low levels of carbon intensity. Countries with the highest levels tend to be characterised by strong dependency on oil and coal as well as relatively inefficient technologies to convert and consume energy.
As a measure of “total energy consumed” divided “country population”, the level of energy consumption per capita can be interpreted in several ways. On the one hand, a high score can infer profligate or wasteful use of energy, whilst a low one can infer limited access to energy for large elements of the population. In 2024, half of the ten highest rated countries were in the Middle East where demand for air conditioning is high for long periods of the year. Those ranked in the very lowest levels are generally considered to be of developing nation status or are relatively less densely populated. It is one way of considering the extent to which there is universal access to energy, a key element of the energy transition, within a given country. Iceland overtook Qatar to regain its position as the highest energy consumer per capita, primarily due to data centres. All nations ranked in the lowest ten are in the Global South.
The ratio of energy use to GDP considers the total energy used to support economic and social activity. In aggregating all energy consumption resulting from a wide range of production and consumption activities, it is one measure of how efficient an economy is at using energy. Whilst Ireland appears to be most efficient, this is a result of an adjustment rather than a material reduction in intensity. From 2015, to access low corporation tax rates, several large multinationals relocated their economic activities and underlying intellectual property to Ireland. GDP increased suddenly by 25% without any material impact on energy demand, hence a significantly low score. Of the countries notable for having large energy intensive manufacturing bases, Germany had the lowest energy intensity rating in 2024 at 2.3 megajoules per $GDP, followed by Japan at 3.2, South Korea at 5.2, and China at 5.5.
80% of nations featured in the Statistical Review have decreased their economy-wide energy intensity since 2017, and 82% of countries have improved the carbon intensity of their energy consumption since 2017. This highlights how globally countries are demonstrating the ability to decouple energy consumption from economic growth, and consequently the decoupling of energy related emissions and economic growth.
The carbon intensity of an economy highlights how much CO2 a country emits per $ GDP it generates in economic activity. It is a measure used in some countries NDCs. For example, China has committed to lower the carbon intensity of its GDP by 60~65% from 2005 levels by 2030. Here, we look at the amount of energy-related CO2 emissions emitted per $ GDP genrated. Half of the ten countries with the most carbon intense economies are situated in the Middle East.
The methodology for compiling the EI Statistical Review of World Energy can be found here.
All of the data behind the charts used in this assessment are available as Excel and CSV downloads. The tables contain additional data for 1990, 2008, 2012, 2017 and 2024 for all countries itemised in the Statistical Review. This enables users to take a historical view of change over time but also to benchmark progress against the pivotal years of: